What is Food Insecurity?
According to the USDA, food insecurity is defined as the “lack of consistent access to enough food for every person in a household to live an active, healthy life.” Food insecurity can be caused by several different life circumstances including poverty, illness, and systemic racism [1].
Why is it Important?
Food insecurity is widespread across the United States, affecting more than 44 million people, 13 million of those being children [1]. In Georgia alone, 1 in 9 people face food insecurity [2]. Food insecurity deeply affects people’s daily lives, and prohibits the ability to live a full, healthy life. Because it is such a vast issue, it is also a difficult one to solve.

How Can We Help?
A key step to addressing the issue of food insecurity is raising awareness. This project aims to explore the issue of food insecurity here in Georgia, highlighting where there may be food deserts within the state. We aim to explore food insecurity in each county by different variables, demonstrating possible predictors of food insecurity. Our goal in doing so is to provide you with knowledge on this issue, so that we as a community can better advocate for reform and inform others about food insecurity in our own communities.
Terminology to Know
Low-Access: In this dataset, food access can be defined by the distance to the nearest supermarket, supercenter, or large grocery store. For urban counties, we consider individuals who live more than 1 mile away from the nearest supermarket or grocery store as food insecure. For rural counties, where population density is intrinsically lower and grocery stores are fewer, individuals are considered to be food insecure if they live greater than 10 miles from the nearest food source.
Low-Income: Low-income counties, as defined by the Department of Treasury’s New Markets Tax Credit (NMTC) program, are those where the poverty rate is 20% or greater, the median family income of the county is less than 80% of the state’s median family income, or the tract is in a metropolitan area and the median family income is less than 80% of the greater metropolitan median family income.
Food Desert: Regions of the country [that] often feature large proportions of households with low incomes, inadequate access to transportation, and a limited number of food retailers providing fresh produce and healthy groceries for affordable prices. [6]
Poverty Rate: The proportion of the population in the county that lives below the Federal poverty threshold.
Urban: According to the US Census, to qualify as an urban area, the territory identified according to criteria must encompass at least 2,000 housing units or have a population of at least 5,000.
Rural: According to the US Census, all people, housing, and territory that are not within an urban area.
SNAP: Supplemental Nutrition Assistance Program (SNAP) is the largest federal nutrition assistance program. SNAP provides benefits to eligible low-income individuals and families via an Electronic Benefits Transfer card. This card can be used like a debit card to purchase eligible food in authorized retail food stores. [5]
Tract: Small, relatively permanent statistical subdivisions of a county or statistically equivalent entity that can be updated by local participants prior to each decennial census as part of the Census.
The Counties of Georgia
Georgia is made up of 159 counties. The counties can be differentiated as rural and urban.

In 14 Counties in Georgia, at Least 1 in 4 People Face Food Insecurity (Low Income and Low Access).
The graph below shows the percent of county populations that are low income and low access, two factors that determine food insecurity. Low access and low income are encoded by a blue gradient (darker blue being higher percentages of low income/access, lighter being lower percentages). Urban counties are denoted by the presence of a dot; rural counties do not have a dot. Living in a rural versus urban area can greatly affect your proximity to viable food sources.
Across Georgia, there are 14 counties where the rate of food insecurity (low income/low access) exceeds 25% (1 in 4 people). Among these 14 counties, 11 are urban and 3 are rural. Furthermore, all urban counties have at least 8% food insecurity. These trends indicate that urban residents are more likely to face food insecurity.
Taliaferro County, a rural county east of Atlanta, has the highest percentage of food insecurity in the state. Among its 1,717 residents, 47.43% are low income and have low access to food. Chattahoochee County, an urban county southeast of Columbus, has the second highest percentage of food insecurity, as 39.34% of its 11,267 residents are low income and have low access to food.

How Far Does Food Insecurity Travel?
The previous map considers individuals as food insecure if they are located greater than a mile from the nearest grocery store in urban counties, and greater than 10 miles for rural counties. But how does food insecurity change across distances in all counties?
The parallel coordinates below explores this question, displaying the overall trends in food insecurity across distance for all Georgia counties. Most counties, both urban and rural, follow a similar pattern with food insecurity (low income/low access) rates decreasing slightly between half a mile and one mile, and significantly dropping off at 10 miles. All urban counties have food insecurity rates at or around 0% at 10 miles. However, many rural counties have much higher rates at 10 miles. We see again that Taliaferro county has the highest percentage of food insecurity at both the 1 mile distance marker and 10 mile distance marker. However, it is actually Atkinson county, a rural county in southern Georgia, that has the highest food insecurity rate at the half mile marker.

Food Insecurity Impacts Even Densely Populated Regions
In addition to just living in either a rural or urban area, the population density of a location can greatly affect the food resources available to residents of an area. The Pareto chart below explores the question: How does a county’s population/population density influence the likelihood that the county has food insecurity issues? The histogram groups counties by their population density. The color saturation/heat map encodes the number of food insecurity in the county at 1 and 10 miles (these are Census identified mile markers for food deserts). The orange trend line shows the cumulative percentage of food insecurity cases across the state , and allows you to see which levels of population density account for what percentage of food insecurity instances in the state. Looking at the graphs, we can see that there is a large distinction between population density in rural and urban areas. This gap indicates that areas in Georgia are either very sparsely populated or very heavily populated, with little existence of a middle ground. While you might expect that food insecurity is more present in sparsely populated areas, where people would theoretically be living further from grocery stores, the opposite is actually true. In fact ~38% of the food insecurity cases in Georgia exist in the 5 most densely populated counties: Fulton, Clayton, Gwinnett, Cobb, and DeKalb. When considering just counties that contain more urban census tracts than rural census tracts, their responsibility for food insecurity cases jumps to around 45%.


Access to Cars May Also Mean Access to Food
Personal vehicle access is associated with a lower risk of food insecurity, serving as a significant factor in easily accessing healthy foods [8]. Particularly in regions with food deserts, understanding the relationship between the number of housing units per county with no vehicle access and the number of people in the county considered to be low access, is a part of fully recognizing the impacts of food insecurity. The scatterplot below thus seeks to answer the question: Is there a relationship between a county’s number of housing units with no vehicle access and the number of individuals considered low access? This scatterplot shows this relationship divided by Urban and Rural counties. The color of each point is determined by the poverty rate in each county, with darker colors indicating higher poverty. When filtered to show Urban counties, it is clear that there is a slight positive correlation between individuals considered low access and the number of housing units with no vehicle access. Fulton County, in particular, has a high low access population and high number of housing units with no vehicle access. However, the poverty rate remains at 15.6%. With rural counties, there is no clear correlation.

Does Race Play a Role in Food Insecurity?
Systemic racism can be a factor in the creation of communities with high levels of food insecurity. The following graph demonstrates food insecurity by race. Each dot is a county, and the x-axis shows the low access population of each race for a particular county. The size of the dot corresponds to the size of the total low access population of a county. As we expect, larger counties tend to have larger low access populations for each race; however, some counties, such as Cherokee county, have a large low access population for a particular race despite not having a large total low access population. This suggests that there is a disparity in food insecurity for certain races in certain counties.To compare the low access populations by race for a particular county, click on one of the dots, and the visualization will highlight all of the dots for that county.

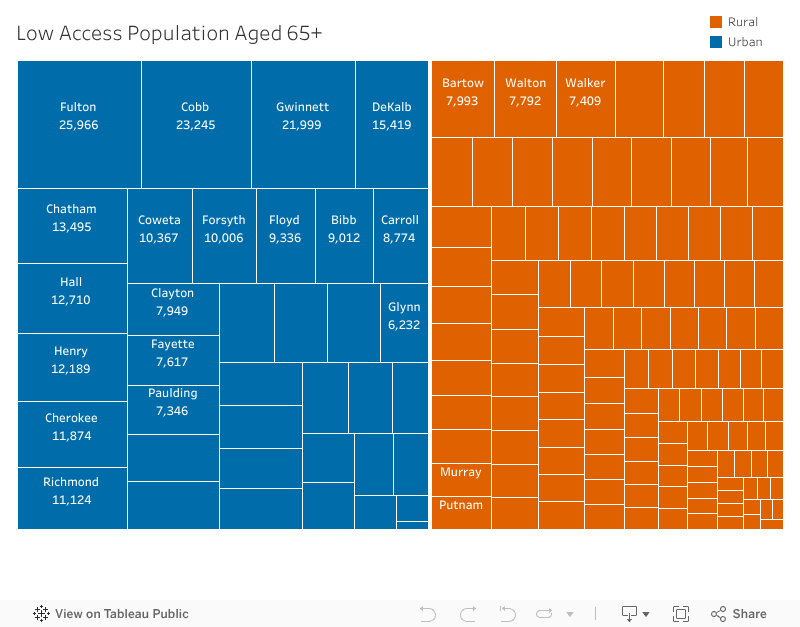
Vulnerable Groups Experience High Levels of Food Insecurity
In addition to race, seniors and children experience high levels of food insecurity. Seniors in particular generally have limited finances and resources [3]. Children experience food insecurity at high rates, especially those situated in single mother households, which has one of the highest food insecurity rates [4]. The treemaps below show the number of kids and seniors in each county that face food insecurity issues.The biggest takeaway from this graph is the sheer number of these more vulnerable groups, and especially children, that experience food insecurity. Again, we see the most densely populated counties experiencing extreme amounts of food insecurity, with Gwinnett alone having 93,063 children experiencing food insecurity issues. Generally speaking, the five most heavily populated counties again top the charts with cases for vulnerable groups, though not necessarily in the same order. Additionally, a much higher proportion of food insecurity cases amongst kids are found in urban counties, while this distribution evens out slightly with the senior population.

Food Assistance Programs Are a Start to Solving Food Insecurity
You may be wondering if there are any current solutions to this challenge that such a large number of people face daily. Governmental assistance programs such as SNAP are a viable resource to provide low income individuals and families with greater access to food. The following scatterplot demonstrates poverty rate on the x axis, and allows for you to change the y axis to SNAP households in general, and SNAP households that are either 1 mile or 10 miles from a grocery store (these are two distance standards for food deserts for urban and rural areas respectively, as determined by the US Census). The scatterplots reveal that though there are many households that utilize SNAP in Georgia, there is not much correlation between poverty rate and SNAP usage or lack thereof, even for those living within the furthest measured distance from a grocery store (10 miles).

Close to Home: How Much Food Insecurity is Present in The Counties We Live In?
Now that we know more about the prevalence of food insecurity in Georgia, you may be overwhelmed by the question “There’s so much need across the state, how can we help?”. In order to put the need into a more tangible context, the bump chart below shows the counties where we are, in the Metro Atlanta area, ranked from 1-11, 1 being the most food insecure of the group, and 11 being the least, across 4 years from 2018-2021 [7]. Hover over each point to see the percentage of food insecurity in each county over the years. As we can see, food insecurity is an issue closer to us than it seems. So, what can we do about it?

There are many things we can do locally to take action towards solving food insecurity:
-Volunteer at your local food bank. The Atlanta Community Food Bank serves these counties and more, and has several volunteer opportunities for you to get involved and make a difference in your local community.
-Donate to organizations who are fighting hunger and food insecurity.
-Continue to raise awareness of food insecurity! Food insecurity affects people all across the country. The more informed we are about the issue, the better equipped we will be to solve it.
About the Data
Data and information is sourced from the 2019 Food Access Research Atlas Data provided by the USDA Economic Research Service. The dataset divides data by Census tracts. For our project, tract data was aggregated by county.
https://www.ers.usda.gov/data-products/food-access-research-atlas/download-the-data/
Data for the bump chart that outlined counties’ ranked food insecurity from the years 2018- 2021 is sourced from data provided by Feeding America.
https://map.feedingamerica.org/county/2021/overall/georgia/county/rockdale
Sources
[1] https://www.feedingamerica.org/hunger-in-america/food-insecurity
[2] https://www.feedingamerica.org/hunger-in-america/georgia
[3] https://frac.org/wp-content/uploads/hunger-is-a-health-issue-for-older-adults-1.pdf
[5] https://www.benefits.gov/benefit/361
[6] https://www.ers.usda.gov/webdocs/publications/45014/30940_err140.pdf
[7] https://map.feedingamerica.org/county/2021/overall/georgia/county/rockdale